The Federal Reserve with its jumbo half-point rate cut dominated the headlines last week, spurring a panoply of questions as to whether it was the right size, how fast will it go down and where will it end. This week, the focus shifted back to the economy where developments will ultimately provide answers to those questions. To be sure, neither the Fed nor economic developments is pushing politics into the woodworks, Not only is the race, and the growing uncertainty that it is stoking, still front and center in investor minds, the candidates are stealthily unveiling their economic proposals. So far, the attention-getting prospect of higher tariffs or taxes on unearned income is garnering mixed reviews at best in the market; but the impact of these vote-seeking messages is diluted by time-honored skepticism among investors that election promises are more noise than signal.
Perhaps the stand-out feature of this weeks economic calendar is that it shined a spotlight on how resilient the economy is shaping up to be. Revisions do not usually affect investor perceptions, but the Governments annual re-estimate of the economy’s performance over the past five years are so dramatic they are hard to ignore. Based on more complete information, the revised data show that the economy expanded by 2.2 percent since 2019, a pace considerably faster than the decade before the pandemic. It also lifts the economy 1.4 percent higher than was thought prior to the revisions.
More important is that the revisions solved a puzzle that had been bedeviling economists in recent years. Even prior to the revisions GDP had been growing at a surprisingly robust pace despite the Feds aggressive rate-hiking campaign since the spring of 2022. However, GDP measures the output side of the economy and the income side had been growing much more slowly. The two government measures of output and income (GDP and GDI) should be roughly equal, but the discrepancy in recent years has been unusually wide, more than 3 percent. This has led many to question whether GDP was overstating the economy’s strength.
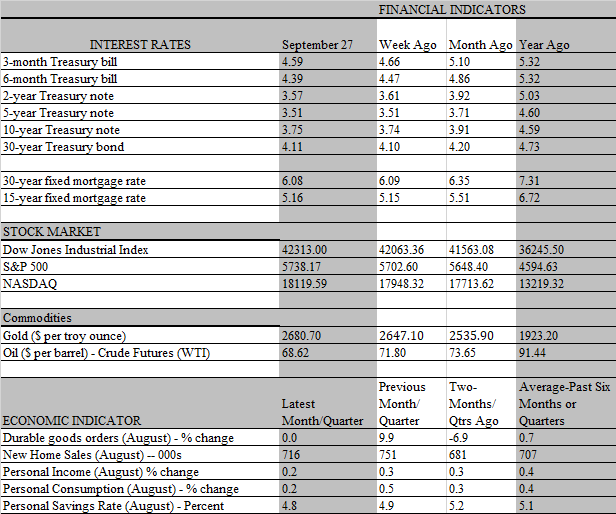
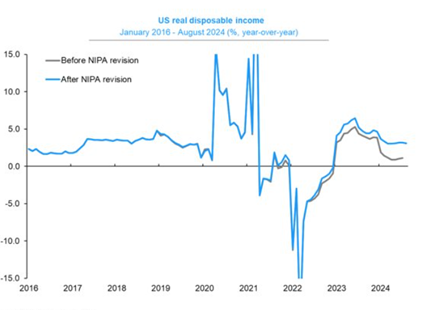
What the revisions reveal, however, is that incomes were being underestimated and the upward adjustment over the past five years has been considerably larger for incomes than for the output side of the ledger. Prior to revisions, spending growth outpaced income growth by 2 to 1. Now just the opposite is the case. Indeed, real disposable income increased 3.1 percent over the past year (through August) compared to 2.9 for real consumer spending. This has more than just statistical significance. The faster growth in personal incomes and profits (both of which were revised higher) means that households and businesses had more firepower to support spending and investment.
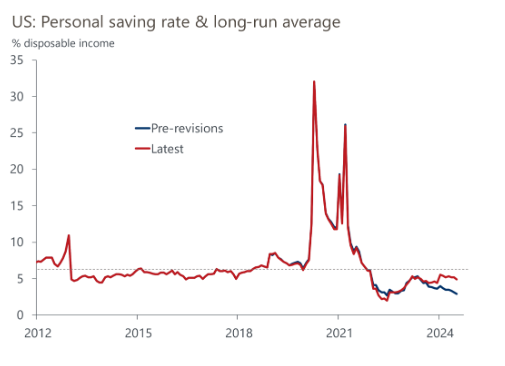
Just as important is that revisions indicate that households did not have to rely as much on borrowing to sustain spending, nor did they exhaust nearly as much savings in the process. The savings rate has actually grew over the past three years, instead of declining, and currently sits at a relatively comfortable 4.8 percent. That’s still a tad below the long-term average, but about 2 percent higher than before the revisions. Its unclear how the upward adjustment in savings is distributed among income groups. Odds are, most of the higher savings resides in the accounts of middle-and-upper individuals. But this cohort accounts for 90 percent of consumer outlays, which means there is far more spending firepower in the pipeline than thought. This, in turn, benefits people further down the income ladder as consumer spending is the main driver of economic growth and, by extension, jobs and worker pay.
Not only does the data through the second quarter look more vigorous than before, thanks to revisions, but the economys resilience is clearly holding up in the current quarter. The day after the revised quarterly data on GDP and GDI were released, the Commerce Department released new data on personal income and spending for August. Consumers increased their spending by a slim 0.2 percent during the month (0.1% after adjusting for inflation) but that comes after a torrid 0.5 percent leap in August and mainly reflects a setback in auto sales after a muscular increase in July. With one month left to go in the quarter, real spending is on track for a 3 percent annualized increase in the third quarter, which would be a tad stronger than the sturdy 2.8 percent increase in the second quarter.
On the surface, personal incomes also came in on the sluggish side in August, rising by only 0.2 percent, the weakest monthly increase since last July. But the overall increase masks a pillar of strength, as wages and salaries staged a formidable 0.5 percent advance. The big drag on overall incomes reflected a sizeable drop in interest receipts from financial assets. While the Fed made its first rate cut in September, market yields had fallen quite dramatically in the months prior to the policy meeting in anticipation of the rate cut. It is those declines that dragged down interest incomes. The 10-year Treasury yield fell a full percentage point between early June and the day before the Feds meeting on September 17-18. Interestingly, market yields have since increased following the meeting, so the income drag from this source may be muted in coming months.
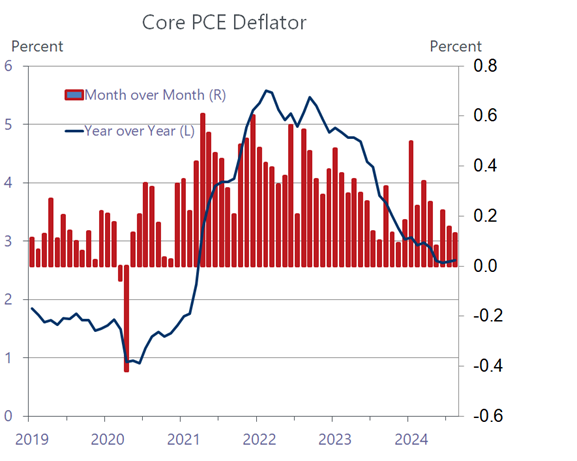
From the Feds perspective, the revised data on GDP further confirms its confidence that the economy can continue to grow at a respectable pace without stoking higher inflation. With job growth slowing and output revised higher, that means stronger productivity was even more of a driving force in recent years. If trend productivity has been nudged higher, employers can pay their workers more without having to raise prices. Unsurprisingly, the August data on personal income and spending also shows that inflation continues to cool. The increase in the personal consumption deflator which the Fed targets as its preferred inflation measure, slid 0.3 % to 2.2 percent from a year ago in August, just a tad above the 2 percent target. The core deflator, which strips out volatile food and energy prices, did tick up 0.1 percent to a year-over-year pace of 2.7 percent, owing to sticky housing costs that are expected to fade over the coming year. Even so, this measure has been trending lower, rising only 0.1 percent from July to August, and by an annual rate of 2.1 percent over the last three months.
From our lens, the steady cooling of inflation keeps the door open for the Fed to keep cutting rates through 2023. However, the economy’s resilience also suggests that the Fed can move more cautiously than the first half-point cut initiated on September 18, as the economy needs less help from lower rates than thought. Still, the risk is that the job market will show more weakness than the Fed feels comfortable with. The September jobs report, out next week, should be decent but the looming longshoremen’s strike scheduled to start October 1 could deal a blow to the Octobers report, leading to outright declines in payrolls. That tilts the risk towards another half point cut in November, if the strike is not resolved quickly.