The debate over whether the Fed will cut rates by 25 or 50 basis points at next weeks FOMC meeting is still unsettled, but the odds for the smaller cut have increased following a stronger-than-expected inflation report this week and, to a lesser extent, further evidence that the labor market is holding up. For sure, the Fed could find reasons to take the more aggressive move if it was so inclined. Despite the upside surprise in the core inflation rate for August, core goods prices continued to deflate and the main catalysts behind the strength in service prices are not likely to stick. What’s more, the persistent low level of claims for jobless benefits, despite a modest uptick in the latest week, simply means that companies are holding on to workers, which masks overriding evidence that the labor market is steadily cooling.
That said, the case for a traditional quarter-percent pivot towards ease is not only likely but justified by emerging conditions. The risk that the job market is deteriorating more dramatically than generally perceived is nontrivial but unlikely. Companies do not engage in widespread layoffs unless they perceive revenues are vulnerable to an imminent drop in sales. That threat is clearly not on the radar. Consumers are keeping their wallets open, even as signs of financial stress among lower-income households are increasing. Job growth remains solid, although cooling, wages are rising and have more than caught up with inflation and household balance sheets are in good shape. According to the Feds latest data on household balance sheets released Thursday, household net worth rose by another $2.7 trillion in the second quarter, buoyed by a $1.7 trillion increase in housing equity and $700 billion in appreciating stock portfolios.
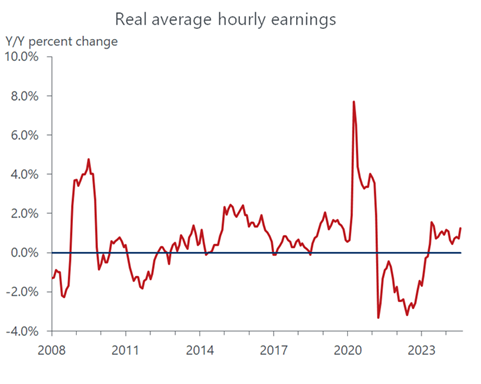
While the wealth effect is having a positive impact, household purchasing power is driven primarily by real incomes. In 2021 and early 2022 spiraling inflation robbed consumers of their spending power and sent confidence tumbling but that is clearly no longer the case. Inflation peaked in mid-2022 and since May of last year wage growth has outpaced the annual increase in prices. Importantly for the Fed, the turnaround has occurred for all the right reasons: both wage growth and inflation have slowed, but the inflation retreat has been steeper. That, in turn, is the recipe for a soft landing, as consumer purchasing power has strengthened supporting consumption, the economy’s main growth driver while cooling inflation allows the Fed to gradually take its foot off the brakes, providing fuel for growth but lessening the risk of an inflation flareup.
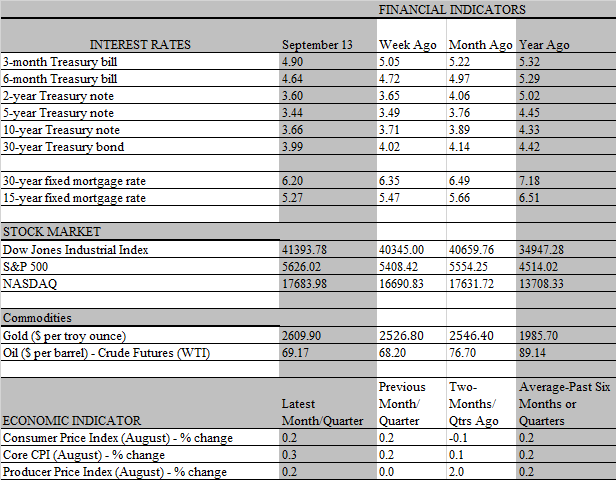
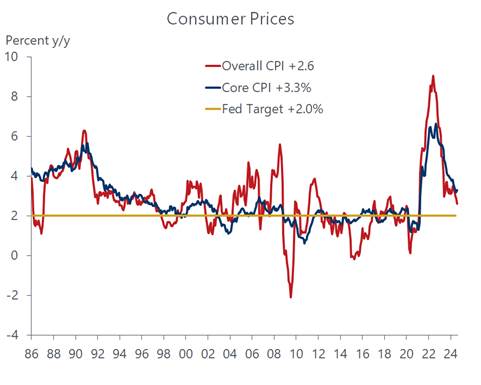
True, the August CPI report puts a speed bump on the path towards the Feds 2 percent inflation target. The headline was more than gratifying, as the increase in the overall consumer price index slowed to 2.6 percent from a year ago compared to 2.9 percent in March, matching the slimmest annual increase since February 2021. But the slowdown received a big assist from a slump in oil prices in August, which along with food prices, can be highly volatile and obscure the underlying inflation trend. What stiffened the odds against a half-point rate cut by the Fed was the uptick in core consumer prices, which strips out food and energy items. The core cpi ticked up to 3.3 percent from a year ago from 3.2 percent in July, following a stronger than expected month-to-month increase of 0.3 percent. The increase in the annual rate was the first reacceleration since March 2023, and reinforced the notion that the last mile towards wrestling inflation down to the Feds 2 percent target would be rough sledding, arguing for a more cautious rate cut by the Fed next week.
But just as the headline CPI overstated the inflation slowdown, the uptick in the core index is more noise than a signal the disinflation trend has stalled. Shelter costs, which comprise about 40 percent of the core, staged a surprisingly strong 0.5 advance in August, the fastest monthly increase since January. Excluding shelter, the core CPI remained firmly on the disinflationary path, rising 1.7 percent over the past year, the slimmest gain since March 2021. Shelter costs are slower to recede than other prices and, given the housing shortage relative to demand, will likely prove stickier as well.
But the shelter measure in the CPI is slow to capture the decline in market rents currently underway, which should start to filter through in coming months. What�s more, the housing component has a smaller weight in the personal consumption deflator, the inflation measure that the Fed targets. We expect the deflator to continue the slowing trend when it is released later this month. Still, there are upside risks to the trend in housing costs, as the rate cuts expected in coming months will stoke mortgage applications and home sales amid the still lean supply in the market for existing homes. Mortgage rates have already declined by a full percentage point since May and further reductions could reinvigorate the demand for home equity loans, providing more fuel for consumer spending and another reason for the Fed to move cautiously when it starts its rate-cutting campaign.
Importantly, the improved prospect of a soft landing and expectations of rate cuts are lifting consumer confidence out of the doldrums. Surveys by the University of Michigan and the Conference Board confirm the improving mindset of households in recent months. The link between these surveys and actual consumer spending is not very tight and can be particularly loose during a presidential election year as they are heavily influenced by political biases. One measure that presumably gets around this defect and relies more on hard data is the so-called misery index popularized by economist Arthur Okun in the 1970s. This measure combines the unemployment rate with the 12-month inflation rate and indicates a happier mindset among the average citizen when the index is lower and more misery when it is higher. With an inflation target of 2 percent and an historically full-employment jobless rate between 4 and 5 percent, a misery index in the range of 6-7 percent should depict the happiest of times. The current index at 6.8 percent falls squarely in that range.
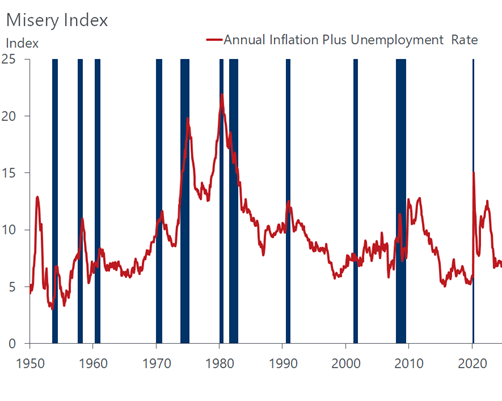
Like most economic indicators the misery index contains flaws that dilutes its usefulness. It assumes, for example, that the average citizen gives equal weight to inflation and unemployment. Inflation hawks are quick to point out, however, that unemployment affects 7 million people while inflation stings over 300 million U.S. residents. By this metric, the Fed should focus more on curbing inflation than minimizing unemployment. But studies have shown that just the opposite of those numbers is the case, as the average citizen is far more willing to accept more inflation than risk losing a job. Given the way the components of the misery index are traveling inflation down and unemployment up the Fed is likely to have more sympathy for those studies, leading to a steady dose of gradual rate cuts over the coming year.